Weekly market news 14/09/2026
Weekly market news 14/09/2026

- Overview of the Mongolian Stock Exchange.
- Mongolian commercial banks’ external debt rises 2.6-fold in three years to $4.4 billion.
- Mongolian stock market valuation rises as two companies join the ₮3 trillion club.
- Exports increased by 57.2% year-on-year
- Oil price surge renews inflation risks and puts pressure on central bank policy.
- European central bank raises policy rates again, focusing on inflation risks.
- Overview of global stock markets.
► MONGOLIAN STOCK EXCHANGE
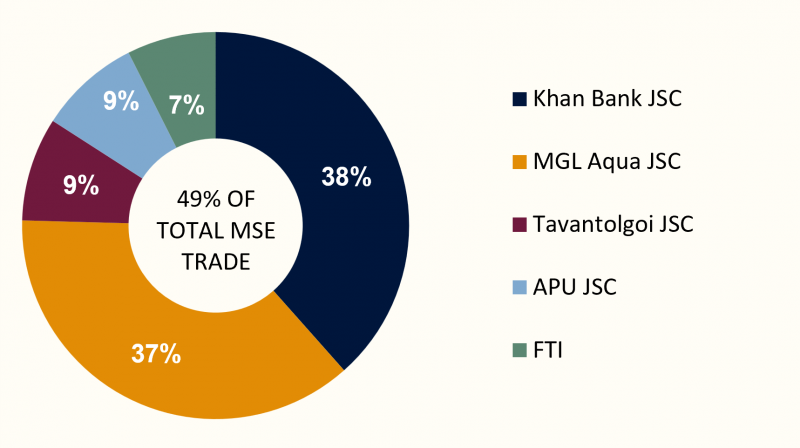
Over the course of the week, a total of 13.7 million securities with a combined value of MNT 6.81 billion were traded on the Mongolian Stock Exchange. By trading value, Khan bank JSC, MGL Aqua JSC, Tavantolgoi JSC, APU JSC, and FTI were the most actively traded securities. A total of one block trades were executed during the period, as follows:
- MGL Aqua JSC (MGLA) – 4.5 million securities at MNT 276.18 per share, totaling MNT 1.2 billion.
The overall market sentiment remained weak last week, with declines in the TOP-20 and FTI indices dominating market performance. Meanwhile, the MSE A index recorded a modest increase, indicating positive momentum in certain segments of the market. The 1.23% decline in the FTI index suggests relatively weaker performance among small- and mid-cap stocks. Therefore, despite the slightly negative overall market sentiment, growth opportunities remained in certain sectors and individual stocks. Overall, while the market outlook was slightly negative, investor interest in large-cap companies with strong financial performance remained resilient.
| INDEX | INDEX | INDEX |
| TOP 20 Index | 63,054.98 | -0.56% |
| MSE A Index | 24,470.87 | +0.17% |
| MSE B Index | 15,254.90 | -0.06% |
| FTI Index | 1,053.71 | -1.23% |
⇒ MONGOLIAN COMMERCIAL BANKS’ EXTERNAL DEBT RISES 2.6-FOLD IN THREE YEARS TO $4.4 BILLION
External debt of Mongolia’s commercial banks reached $4.4 billion at the end of Q2 2026, up $1.3 billion, or 41.2%, from the same period a year earlier. Compared with Q2 2023, banks’ external debt has increased 2.6-fold and now accounts for 11.4% of Mongolia’s total external debt.
Foreign direct investment and intercompany lending accounted for the largest share of total external debt at $17.6 billion, or 45.0%, followed by the government at $8.4 billion, or 21.5%, other sectors at $7.6 billion, or 19.3%, and commercial banks at $4.4 billion, or 11.4%. While banks’ external debt increased 41.2%, government external debt declined 3.2%, FDI and intercompany lending fell 1.9%, and the Bank of Mongolia’s external debt decreased 29.5%.
Greater access to external funding allows banks to diversify their sources of financing, but also increases exposure to foreign-exchange, external funding-cost and refinancing risks. Beyond the size of external liabilities, attention will therefore remain on how these funds are deployed across lending and investments, as well as the strength of banks’ foreign-exchange risk management.
Meanwhile, the government’s domestic debt increased 60.2% to ₮2.0 trillion, indicating a greater reliance on domestic sources of financing.
⇒ MONGOLIAN STOCK MARKET VALUATION RISES AS TWO COMPANIES JOIN THE ₮3 TRILLION CLUB
The Mongolian Stock Exchange’s equity market saw a rise in the valuations of major listed companies, with the number of companies valued at more than ₮3 trillion reaching two. Tavantolgoi JSC (TTL) saw its share price surge 37.7% in one week, lifting its market capitalization to ₮3.2 trillion and briefly overtaking Khan Bank JSC (KHAN) as the most valuable company on the exchange. By last Friday, however, TTL had declined 5.4% while KHAN gained 2.6%, putting Khan Bank back at the top by market capitalization.
By market capitalization, three of the five companies valued above ₮1 trillion are from the banking sector, highlighting the continued importance of the banking and mining sectors to Mongolia’s equity market. At the same time, while two companies have now surpassed the ₮3 trillion mark, there are no companies valued around ₮2 trillion, pointing to a notable valuation gap among the market’s largest issuers.
According to the Mongolian Stock Exchange, total trading value reached ₮872.2 billion from September 7–11. Of this, ₮699.4 billion came from coal trading, ₮9.2 billion from iron trading, and ₮56.8 billion from molybdenum concentrate trading, while the remaining ₮106.8 billion was accounted for by securities trading. This indicates that mining commodity trading, alongside the equity market, continues to make a significant contribution to overall activity on the exchange.
⇒ EXPORTS INCREASED BY 57.2% YEAR-ON-YEAR
As of the first eight months of 2026, Mongolia’s exports reached USD 14.4 billion, increasing by USD 5.2 billion, or 57.2%, compared with the same period of the previous year. As a result, the foreign trade balance recorded a surplus of USD 6.0 billion, representing a 3.6-fold increase year-on-year.
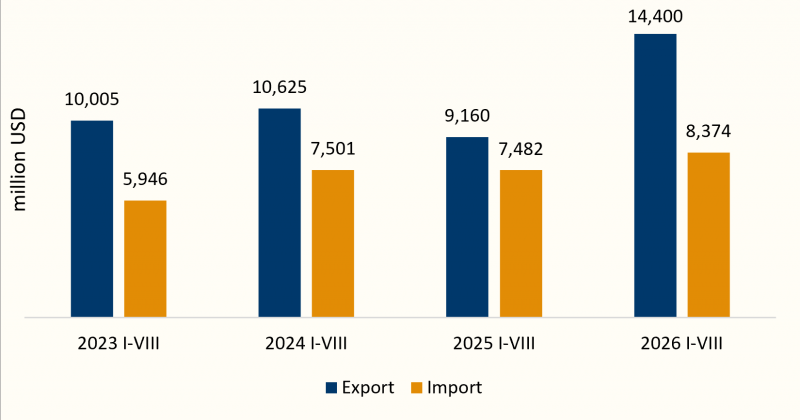
The growth in exports was primarily driven by increased shipments of mining products. Exports of copper ore and concentrates increased by USD 2.8 billion, while coal exports rose by USD 1.9 billion. In addition, exports of unwrought and semi-processed gold increased by USD 255.6 million, while combed cashmere exports rose by USD 97.1 million, contributing significantly to overall export earnings.
In terms of export composition, copper ore and concentrates accounted for 43.7% of total exports, while hard coal accounted for 37.0%. Together, these two products represented more than 80% of total exports. Meanwhile, the share of gold exports reached 5.6%.
China remained Mongolia’s primary export market, receiving USD 13.3 billion worth of Mongolian products, equivalent to 92.7% of total exports. Copper ore and concentrates accounted for 47.1% of exports to China, while coal represented 40.7%.
These figures indicate that during the first eight months of 2026, Mongolia’s export growth was mainly driven by increases in both the volume and value of copper ore and concentrates and coal exports, with the mining sector continuing to be the country’s primary source of export earnings.
Global equity markets had a broadly weaker and more risk-averse week, as rising oil prices, persistent inflation and higher government bond yields weighed on investor sentiment. In the U.S., inflation data increased expectations for a Fed rate hike, while in Europe, higher energy prices reinforced expectations of further ECB tightening. Asian markets were particularly sensitive to the combination of higher global yields, elevated energy prices and pressure on technology stocks. Meanwhile, continued disruptions to shipping through the Strait of Hormuz kept Brent crude near or above $100 per barrel, increasing the risk of further inflationary pressure and tighter monetary policy. Going forward, markets will remain focused on the Fed’s September decision, oil prices, government bond yields and developments in the Middle East.
U.S. STOCK MARKET
- S&P 500: -0.79%
- Dow Jones: -1.01%
- Nasdaq: -0.74%
U.S. equities weakened during the week of September 7–11, with the S&P 500 down 0.79%, the Dow Jones 1.01%, and the Nasdaq 0.74%. Rising oil prices and renewed inflation concerns were the main sources of pressure, with Brent crude gaining more than 7.5% over the week. August consumer inflation also increased 0.4% month on month, strengthening expectations that the Federal Reserve could raise rates at its September meeting, with market-implied odds reaching around 85%. The 10-year U.S. government bond yield reached around 4.97% during the week, approaching its highest level since October 2023, adding further pressure to equity valuations.
EUROPEAN STOCK MARKET
- FTSE 100: -1.67%
- STOXX Europe 600: -1.58%
- DAX 40: -1.81%
- CAC 40: -1.12%
European equities also declined, with the FTSE 100 falling 1.67%, STOXX Europe 600 1.58%, DAX 40 1.81%, and CAC 40 1.12%. Renewed tensions in the Middle East and higher oil prices increased inflation concerns and strengthened expectations for further monetary-policy tightening by the European Central Bank. Eurozone GDP expanded 0.6% quarter on quarter and 1.2% year on year in the second quarter, exceeding expectations, but the positive economic data was outweighed by renewed energy and inflation risks. Markets increasingly priced in a 25-basis-point ECB rate increase in September, with Deutsche Bank also expecting another quarter-point increase later in the year.
ASIAN STOCK MARKET
- Nikkei 225: -2.42%
- KOSPI: -1.22%
- CSI 300: -1.26%
- SSEC: -1.38%
Asian markets broadly declined, with the Nikkei 225 falling 2.42%, KOSPI 1.22%, CSI 300 1.26%, and Shanghai Composite 1.38%. Brent crude moving above $100 per barrel and rising global bond yields increased concerns over energy costs and monetary-policy tightening, putting particular pressure on Japanese, South Korean and other technology-heavy markets. In China, higher expectations for U.S. rate increases, profit-taking following the earlier AI-led rally and weaker market liquidity contributed to the decline in mainland equities. South Korean technology stocks also came under pressure, with Samsung Electronics and SK Hynix falling sharply as higher yields and energy prices weighed on risk appetite.
⇒ ️ OIL PRICE SURGE RENEWS INFLATION RISKS AND PUTS PRESSURE ON CENTRAL BANK POLICY
Brent crude briefly reached $109.97 per barrel on September 11 before easing, but remained above the $100 level. Brent gained more than 8% over the week, increasing concerns that supply disruptions could persist and continue to put pressure on global energy markets.
The main driver has been the ongoing U.S.-Iran conflict and restrictions on oil shipments through the Strait of Hormuz. Oil flows through the strait have fallen to around half of pre-conflict levels, at approximately 10 million barrels per day. In addition, Saudi Arabia’s key East-West oil pipeline, which transports crude toward the Red Sea, was shut following an attack, further increasing concerns over supply disruptions.
Efforts to reach a diplomatic solution have also faced setbacks. A meeting planned in Oman to discuss arrangements for shipping through the Strait of Hormuz was postponed, adding to uncertainty over when oil transportation through the key waterway could return to normal.
The sustained rise in oil prices is no longer only an energy-market issue but is increasingly becoming a key factor for inflation and monetary policy. In the United States, higher oil prices could add to inflationary pressures and influence the Federal Reserve’s rate outlook, while the 10-year U.S. government bond yield has approached 5%. Investors are therefore closely watching oil prices, supply conditions and how central banks respond to the renewed inflation risk.
⇒ EUROPEAN CENTRAL BANK RAISES POLICY RATES AGAIN, FOCUSING ON INFLATION RISKS
The European Central Bank (ECB) raised all three of its key policy rates by 25 basis points on September 10, taking the deposit rate to 2.50%, the main refinancing rate to 2.65% and the marginal lending facility rate to 2.90%. This marked the ECB’s second rate increase of the year, with the new rates taking effect on September 16.
The rate increase was mainly driven by rising energy prices linked to the conflict in the Middle East, which have added to inflationary pressures. The ECB kept its 2026 inflation forecast at 3.0% and revised its forecasts for 2027 and 2028 to 2.5% and 2.1%, respectively.
At the same time, the ECB expects the eurozone economy to grow by 0.9% in 2026 and 1.4% in 2027. However, if energy prices remain elevated and supply disruptions persist, inflationary pressures could increase further and affect the outlook for monetary policy.
From a market perspective, higher oil prices are complicating the inflation outlook and could limit the scope for further rate cuts by central banks. Investors will therefore continue to monitor energy prices, inflation data and the ECB’s next policy decisions.