Weekly market news 04/20/2026
Weekly market news 04/20/2026
- Overview of trading activity on the Mongolian Stock Exchange
- Turnover in Mongolia’s securities market has increased, with primary market dominance remaining intact.
- Mongolia’s economy in Q1 2026: Growth has been maintained, though structural challenges persist.
- Geopolitical conditions: A key factor shaping market performance.
- The S&P 500 surpassed the 7,000 level for the first time, reaching a new all-time high.
- Overview of global capital markets
► MONGOLIAN STOCK EXCHANGE
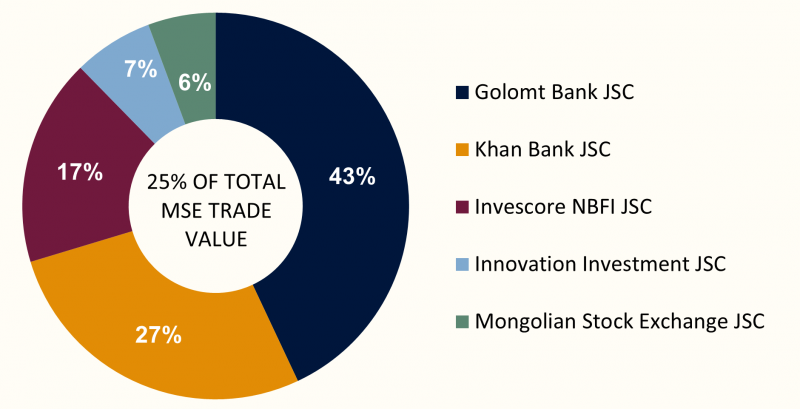
Over the course of the week, a total of 5.09 million securities with a combined value of MNT 7.08 billion were traded on the Mongolian Stock Exchange. In terms of trading value, Golomt Bank JSC, Khan Bank JSC, Innovation Investment JSC, Mongolian Stock Exchange JSC, and Invescore NBFI JSC JSC led market activity, indicating concentration of liquidity in a limited number of actively traded stocks. During the period, a total of one block trade was executed:
- Invescore NBFI JSC (INV): 29.6 thousand shares at MNT 10,240, totaling MNT 303.5 million.
Mongolian Stock Exchange indices closed higher over the past week, reflecting a positive market sentiment. The TOP-20 Index rose +0.97%, the MSE A Index gained +2.00%, and the MSE B Index increased +0.52%. The upward movement was supported by a rebound following the previous ex-dividend related technical decline, as well as improved visibility from ongoing shareholder meetings. The stronger performance of the MSE A Index suggests a more pronounced recovery in mid- and large-cap stocks. At the same time, increased activity in investor forums and promotional events at the international level is helping support longer-term interest in Mongolia’s capital market. Overall, market conditions indicate a transition into a short-term recovery phase.
| INDEX | POINTS | WEEKLY CHANGE |
| TOP 20 Index | 50,603.08 | +0.97% |
| MSE A Index | 19,385.43 | +2.00% |
| MSE B Index | 14,232.92 | +0.52% |
⇒ SECURITIES MARKET TURNOVER RISES, PRIMARY MARKET DOMINANCE REMAINS
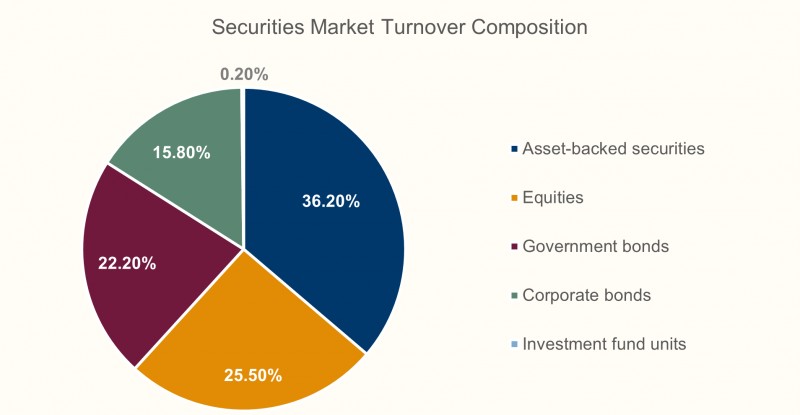
As of Q1 2026, total turnover in Mongolia’s securities market reached MNT 269.5 billion, increasing by MNT 97.0 billion, or 56.2% year-on-year. This growth indicates increased financing activity in the market. The primary market accounted for 52.0% (MNT 140.1 billion) of total turnover, while the secondary market made up 48.0% (MNT 129.5 billion), highlighting the significant role of new issuances and fundraising activities.
Several key trends are evident from market structure and activity:
- Primary market dominance: New issuances and financing transactions are the main drivers of market growth, indicating that the capital market is increasingly being used as a funding channel.
- Limited secondary market participation: Trading activity remains concentrated rather than broadly distributed, suggesting relatively weak liquidity in the secondary market.
- Shift in transaction structure: The number of securities traded declined to 111.6 million units (-58.4% YoY), indicating that growth is driven by higher-value, institutional-type transactions rather than broader retail participation.
- Market rebalancing and asset preference: The high share of asset-backed securities and bonds suggests continued demand for fixed-income instruments, reflecting a degree of risk aversion. At the same time, market capitalization increased on a yearly basis but declined month-on-month, indicating a short-term correction following previous gains.
The TOP-20 Index also showed a year-on-year increase but declined compared to the previous month, reinforcing the view of near-term market adjustment. Total market capitalization reached MNT 13.7 trillion, up on an annual basis but slightly lower on a monthly basis. Overall, Mongolia’s securities market is seeing increased activity and a strengthening role in financing. However, growth remains concentrated in the primary market and high-value transactions, with secondary market liquidity and broader investor participation still limited.
⇒ MONGOLIA’S ECONOMY IN Q1 2026: GROWTH MAINTAINED, STRUCTURAL CHALLENGES PERSIST
As of Q1 2026, Mongolia’s economy maintained a degree of growth and activity, although structural challenges such as sectoral imbalances and relatively subdued domestic demand remain. Macroeconomic indicators suggest improved external sector performance and expanding monetary conditions, supporting overall economic activity, while certain social and demographic indicators continue to reflect underlying pressures.
KEY DRIVERS OF ECONOMIC ACTIVITY
- Total trade turnover: +32.5% YoY
- Exports: +62.3% YoY
- Imports: -2.7% YoY
External trade performance improved significantly, with exports acting as the primary growth driver. The decline in imports points to relatively constrained domestic demand, while the trade balance strengthened, reinforcing the role of the external sector in supporting economic growth.
Industrial sector growth accelerated
- Total industrial output: +61.2% YoY
- Mining: +74.2% YoY
- Electricity and energy: +46.7% YoY
Industrial expansion remained strong, largely driven by mining activity, indicating continued reliance on commodity-driven growth.
- Money supply: +21.3% YoY
- Loan outstanding: +16.6% YoY
- Household loans: +17.7%, Corporate loans: +20.7%
Growth in money supply and credit reflects ongoing financial system expansion and increased economic activity. Rising lending to both households and corporates has supported consumption and investment, although the increase in loans under watch signals emerging pressure on asset quality.
PRICE PRESSURES AND INFLATION
- CPI: +7.4% YoY
- Food prices: +13.9% YoY
- Producer Price Index (industrial): +16.7% YoY
Inflation remained elevated, driven primarily by food prices. At the same time, rising producer prices indicate increasing cost pressures from the supply side.
FISCAL POSITION
- Budget revenue: +11.9% YoY
- Expenditure: +17.9% YoY
- Fiscal balance: deficit widened
In Q1 2026, total budget revenue and grants reached MNT 7.2 trillion, while expenditure and net lending increased sharply to MNT 7.7 trillion, resulting in a MNT 1.4 trillion deficit. Spending growth was driven by capital expenditure, goods and services, and current transfers. Although tax revenues increased modestly, declines in personal income tax and excise tax revenues highlight weaknesses in revenue composition. Overall, faster growth in expenditure relative to revenue reflects an expansionary fiscal stance and rising fiscal pressure.
Overall, Mongolia’s economy maintained growth in Q1 2026, though this expansion remains concentrated in the external sector and mining. Domestic demand conditions remain relatively constrained, inflationary pressures persist, and fiscal expansion has increased. In this context, the composition of growth and sectoral balance continue to be key areas to monitor.
Over the week, global equity markets recorded broad-based gains, with the recovery continuing after previous volatility. This upward movement can be attributed to a partial easing of geopolitical risk pressures, as investors shifted away from a previously cautious stance and risk appetite improved. In addition, signs of stabilization in inflation and interest rate expectations provided short-term support to equity markets.
U.S. STOCK MARKET
- S&P 500: +3.48%
- Dow Jones: +3.62%
- Nasdaq: +7.09%
U.S. markets posted strong gains, with the Nasdaq significantly outperforming, reflecting a sharp rebound in technology and growth stocks. The easing of geopolitical and interest rate uncertainty seen in previous weeks supported a shift back դեպի risk assets. In addition, technical buying following earlier declines contributed to the upward momentum.
EUROPEAN STOCK MARKET
- FTSE 100: +0.80%
- STOXX Europe 600: +2.25%
- DAX 40 (Герман): +4.84%
- CAC 40 (Франц): +3.02%
European markets recorded broad-based gains, with the DAX 40 leading performance. The strength was supported by improved performance in industrial and export-oriented companies. Reduced uncertainty and more stable investor positioning helped drive a consistent, region-wide advance.
ASIAN STOCK MARKET
- Nikkei 225: +3.64%
- KOSPI: +7.92%
- CSI 300: +2.46%
- SSEC : +2.02%
Asian markets delivered overall positive performance, led by a strong surge in South Korea’s KOSPI, driven by recovery in technology and export sectors. Japan and China also posted gains, although at a more moderate and stable pace. The region saw reduced impact from external risks, with domestic factors playing a more prominent role in market movements.
⇒ GEOPOLITICAL DEVELOPMENTS: A KEY DRIVER OF MARKET DYNAMICS
Over the past week, geopolitical tensions in the Middle East intensified again, bringing the Strait of Hormuz back into the center of global market focus. While there have been signals suggesting a potential ceasefire and continued negotiations, conditions on the ground remain unstable. Iran has tightened control over the Strait, while the U.S. continues maritime restrictions targeting Iranian ports, contributing to heightened uncertainty across global oil, shipping, and insurance markets.
According to Iranian sources, the U.S. has not fulfilled prior commitments to ensure safe passage for previously agreed vessels, limiting the possibility of fully reopening the Strait. As a result, maritime traffic through the waterway remains constrained, with some commercial vessels facing delays or rerouting. Although the U.S. has stated that it will not block ships heading to non-Iranian ports via the Strait of Hormuz, Iranian authorities have expressed skepticism regarding the practical implementation of such measures.
With approximately 20% of global oil shipments passing through the Strait of Hormuz, the risk of disruption or restriction remains a critical sensitivity for global markets.
⇒ S&P 500 BREAKS ABOVE 7,000 FOR THE FIRST TIME, REACHING A RECORD HIGH
Mid April 2026 marked a historic moment for global financial markets. The S&P 500, the broadest benchmark of the U.S. stock market, surpassed the 7,000 level for the first time, setting a new all time high. At the same time, the Nasdaq Composite recorded its longest streak of consecutive gains since the 2009 global financial crisis. This rally, extending over more than ten trading days, signals a sharp shift in market sentiment and investor positioning.
In late March, U.S. equities had fallen nearly 10% in a short period amid escalating geopolitical tensions, a surge in oil prices, and renewed concerns over rising inflation. While the U.S.–Iran conflict remains unresolved, expectations of temporary de escalation, investors’ growing tolerance to a steady flow of risk related headlines, and a sharp short term decline in oil prices helped ease inflationary pressures. As a result, investors moved away from defensive positioning and re entered higher risk assets, reinforcing the market’s recovery.
The S&P 500’s third consecutive week of gains, culminating in a decisive break above the 7,000 mark, confirms the realization of a classic “V shaped recovery.” Notably, this advance was led not by banks or energy stocks, but by technology, communications, and consumer oriented growth sectors, suggesting that investors are increasingly confident in a medium term growth narrative rather than a short term rebound.
Meanwhile, gains in the Nasdaq Composite were largely driven by momentum in the artificial intelligence and semiconductor sectors. A strong increase in TSMC’s first quarter 2026 profits demonstrated that massive investments in AI are translating into real revenue and earnings. This, in turn, fueled sharp advances in shares of Nvidia, Broadcom, AMD, and other chipmakers, accelerating the Nasdaq’s overall performance.
The decline of the VIX volatility index below 20 indicates a significant reduction in market fear; however, the rally remains relatively concentrated in a small group of large technology stocks. In such circumstances, analysts caution that profittaking and shortterm pullbacks become increasingly likely following rapid gains.