Weekly market news 17/08/2026
Weekly market news 17/08/2026

- verview of the Mongolian Stock Exchange.
- Bank of Mongolia Raises Policy Rate to 12.5% and Tightens Monetary Policy.
- Money Supply Grows 25.2%, While Credit Growth Remains Relatively High.
- Mongolia’s Budget Deficit Reaches MNT 2.2 Trillion as Expenditure Growth Outpaces Revenue.
- U.S. Federal Budget Deficit Reaches $432 Billion in July, Adding to Fiscal Pressures.
- Clean Energy Technology Market Reaches $1.1 Trillion, Continuing to Grow.
- Overview of global stock markets.
► MONGOLIAN STOCK EXCHANGE
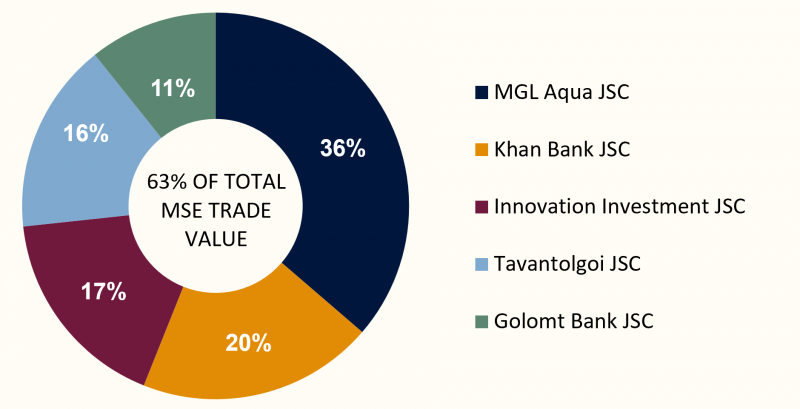
Over the course of the week, a total of 7.6 million securities with a combined value of MNT 3.3 billion were traded on the Mongolian Stock Exchange. By trading value, MGL Aqua JSC, Khan Bank JSC, Innovation Investment JSC, Tavantolgoi JSC, and Golomt Bank JSC were the most actively traded securities. A total of two block trades were executed during the period, as follows:
- MGL Aqua JSC (MGLA) – 1.67 million securities were traded at MNT 300 per share, for a total value of MNT 500 million;
- MGL Aqua JSC (MGLA) – 845 thousand securities were traded at MNT 296 per share, for a total value of MNT 250 million.
The Mongolian Stock Exchange indices delivered mixed performance. The TOP-20 Index rose 1.52%, while the MSE A Index increased 1.21%, indicating continued buying interest in large-cap and leading companies. Meanwhile, the MSE B Index declined 1.88%, while the FTI Index gained 2.59%. This suggests that although the market maintained an overall positive trend, performance was uneven across segments, with relatively stronger investor interest in large-cap equities and investment fund units. As the MSE’s key indices reflect market capitalization and trading activity, the gains in the TOP-20 and MSE A indices can be attributed to the relatively strong performance of leading stocks.
| INDEX | POINTS | WEEKLY CHANGE |
| TOP 20 Index | 55,675.98 | +1.52% |
| MSE A Index | 21,296.03 | +1.21% |
| MSE B Index | 14,617.58 | -1.88% |
| FTI Index | 1,083.43 | +2.59% |
⇒ BANK OF MONGOLIA RAISES POLICY RATE TO 12.5% AND TIGHTENS MONETARY POLICY
The Bank of Mongolia’s Monetary Policy Committee held an extraordinary meeting on August 12, 2026, and decided to raise the policy rate by 0.5 percentage points to 12.5% and increase banks’ MNT reserve requirement by 0.5 percentage points to 14.5%. The decision reflects rising inflation expectations and concerns that supply-side price increases could increasingly pass through to other parts of the economy.
Inflation reached 13.0% in July 2026, while core inflation rose to 6.9%. Domestic food prices, fuel prices, and administratively regulated goods were the main contributors to overall inflation. In particular, higher fuel prices could feed through to transportation, services, and other goods by increasing operating and production costs.
At the same time, economic growth reached 7.3% in the first five months of 2026, driven mainly by mining and transportation. The external sector also remained supportive, with the balance of payments recording a USD 567 million surplus in the first half of the year and foreign exchange reserves reaching USD 7.9 billion.
The increase in the policy rate and reserve requirement is aimed at containing excessive domestic demand and anchoring inflation expectations. While stronger exports and foreign exchange reserves provide a supportive macroeconomic backdrop, continued pressure from fuel and food prices and geopolitical risks could delay the return of inflation to its target range. Conversely, if inflation expectations stabilize and supply-side pressures ease, the impact of the tighter monetary policy should become more evident over the medium term.
⇒ MONEY SUPPLY GROWS 25.2%, WHILE CREDIT GROWTH REMAINS ELEVATED
According to the National Statistics Office’s July 2026 “Money and Loans” statistics, broad money supply (M2) reached MNT 53.1 trillion at the end of July, increasing 25.2% year-on-year. The increase was mainly driven by a 25.1% rise in tugrik deposits, a 24.6% increase in tugrik current accounts, and a 76.9% increase in foreign-currency current accounts.
Total outstanding loans reached MNT 48.2 trillion, up 13.0% year-on-year, although the balance declined 2.2% from the previous month. While 92.2% of total loans were classified as performing, non-performing loans rose 17.2% year-on-year to MNT 2.5 trillion, pointing to growing credit-quality risks.
Meanwhile, loans outstanding from non-bank financial institutions (NBFIs) reached MNT 8.2 trillion at the end of Q2, up 23.3% year-on-year. Notably, NBFI non-performing loans increased 48.7%, indicating that credit risks are becoming more relevant beyond the banking sector as well.
Strong growth in money supply and credit continues to support domestic economic activity, but with inflation remaining elevated, rapid monetary expansion could add to domestic demand pressures. At the same time, rising non-performing loans warrant closer monitoring of credit quality and financial-sector risks as tighter monetary conditions take effect.
⇒ STATE BUDGET DEFICIT REACHES MNT 2.2 TRILLION AS EXPENDITURE GROWTH OUTPACES REVENUE
According to the preliminary execution of Mongolia’s consolidated budget for the first seven months of 2026, total revenue reached MNT 19.8 trillion, up 19.6% year-on-year. Adjusted revenue increased 11.0% to MNT 17.3 trillion.
However, expenditure and net lending grew faster, reaching MNT 19.5 trillion, an increase of 15.5% year-on-year. As a result, the adjusted budget deficit widened to MNT 2.2 trillion, compared with a deficit of MNT 1.3 trillion during the same period last year. Tax revenue remained the main driver of revenue growth, reaching MNT 16.0 trillion, up 10.7%. Social insurance revenue increased 15.8%, VAT revenue by 12.1%, and income tax revenue by 9.8%. Capital expenditure recorded particularly strong growth, reaching MNT 3.6 trillion, up 31.8% year-on-year. Spending on goods and services also increased by 18.3%, contributing to the overall rise in expenditure.
The growth in budget revenue reflects stronger economic activity and an expanding tax base, but faster expenditure growth is placing increasing pressure on the fiscal balance. While higher capital spending could support long-term productivity, fiscal expansion amid elevated inflation may add to domestic demand and increase pressure on monetary policy. Maintaining revenue growth while improving expenditure efficiency, investment returns, and fiscal deficit management will therefore remain important for macroeconomic stability.
Global equity markets delivered a mixed but generally resilient performance during the week. U.S. markets remained relatively stable, European equities were uneven, and Japan and South Korea recorded particularly strong gains. Overall, investor risk appetite remained supported, although inflation, central-bank policy, energy prices, and geopolitical developments continued to be key risks for global markets.
U.S. STOCK MARKET
- S&P 500:+0.44%
- Dow Jones: -0.63%
- Nasdaq: +0.18%
During the week of August 10–16, U.S. equities were relatively stable, with the S&P 500 rising 0.44% and the Nasdaq gaining 0.18%, while the Dow Jones declined 0.63%. Investors remained focused on inflation trends, the Federal Reserve’s policy outlook, and energy prices, keeping market sentiment cautious despite major indices remaining near elevated levels.
EUROPEAN STOCK MARKET
- FTSE 100: -1.03%
- STOXX Europe 600: -0.35%
- DAX 40 (Герман): +0.30%
- CAC 40 (Франц): -0.85%
European markets delivered mixed performance, with the DAX 40 rising 0.30%, while the FTSE 100, STOXX Europe 600, and CAC 40 declined. Geopolitical risks in the Middle East, energy prices, and expectations for monetary policy remained key considerations for investors, while corporate earnings continued to provide some support.
ASIAN STOCK MARKET
- Nikkei 225: +4.26%
- KOSPI: +10.65%
- CSI 300: -0.86%
- SSEC : -0.42%
Asian markets showed the widest divergence, with the Nikkei 225 rising 4.26% and the KOSPI surging 10.65%, while the CSI 300 and SSEC declined modestly. The strong performance in Japan and South Korea reflected renewed buying interest and improved risk appetite, while Chinese equities remained comparatively weaker.
⇒ ️ U.S. FEDERAL BUDGET DEFICIT REACHES $432 BILLION IN JULY, ADDING TO FISCAL PRESSURES
The U.S. federal budget deficit reached $432 billion in July 2026, up 48% from the same month a year earlier and the largest monthly deficit since March 2021. Meanwhile, the cumulative deficit for the first 10 months of fiscal year 2026 reached $1.799 trillion, already exceeding the $1.775 trillion deficit recorded for the full 2025 fiscal year.
Federal government spending reached $766 billion in July, up 22% year-on-year, while revenue declined 1% to $334 billion. However, the figures were partly affected by timing, as certain benefit payments scheduled for August were brought forward into July, increasing monthly spending by approximately $99 billion. After adjusting for this effect, the monthly deficit stood at $333 billion, 18% higher than a year earlier.
A key source of fiscal pressure remains interest payments on federal debt. Interest costs reached $118 billion in July, up 28% year-on-year, while Medicare spending also increased significantly.
Meanwhile, tariff revenues did not provide as much fiscal support as expected. Tariff refunds reached $33.4 billion in July, exceeding newly collected customs duties and resulting in negative net tariff revenue for the month. According to Reuters, the Congressional Budget Office has also reduced its annual tariff revenue estimate by $250 billion from its previous projection.
⇒ CLEAN ENERGY TECHNOLOGY MARKET REACHES $1.2 TRILLION, CONTINUING TO GROW DESPITE TRADE RESTRICTIONS
According to the International Energy Agency (IEA), the global market for clean energy technologies—including solar panels, wind turbines, batteries, electric vehicles, and heat pumps—reached $1.1 trillion in 2025, growing at an average annual rate of around 20% over the past decade. At the same time, technology costs have continued to decline, with solar panel prices falling by approximately 50% and battery prices by 30% between 2023 and 2025.
China continues to dominate the sector in terms of production and investment, while investment has also increased in Europe, South Korea, and India. However, excess manufacturing capacity, particularly in solar panels and batteries, has exceeded demand and contributed to a slowdown in new investment growth.
Meanwhile, rising tariffs and trade restrictions are putting pressure on companies to restructure global supply chains. Nevertheless, the IEA estimates that if current policies remain in place, the global clean energy technology market could exceed $2.6 trillion by 2035.
The growth of clean energy technologies is increasingly becoming not only an energy-transition story but also a key area of industrial policy, trade, and technological competition. Excess capacity, trade barriers, and concentrated supply chains will remain important factors shaping investment returns and the pace of future market growth.