Weekly market news 03/30/2026
Weekly market news 03/30/2026

- Overview of trading activity on the Mongolian Stock Exchange
- The Mongolian tugrik continued to depreciate against the U.S. dollar and other major currencies in February
- The primary market issuance of the “Municipal Bond” was successfully completed with 100% subscription
- U.S. markets show signs of a short-term rebound, although geopolitical uncertainty remains elevated
- Japan’s inflation eased to 1.3%, reducing pressure for further monetary tightening
- China’s industrial profits increased by 15.2%, though the economic recovery remains uneven with persistent risks
- Overview of global capital markets
► MONGOLIAN STOCK EXCHANGE
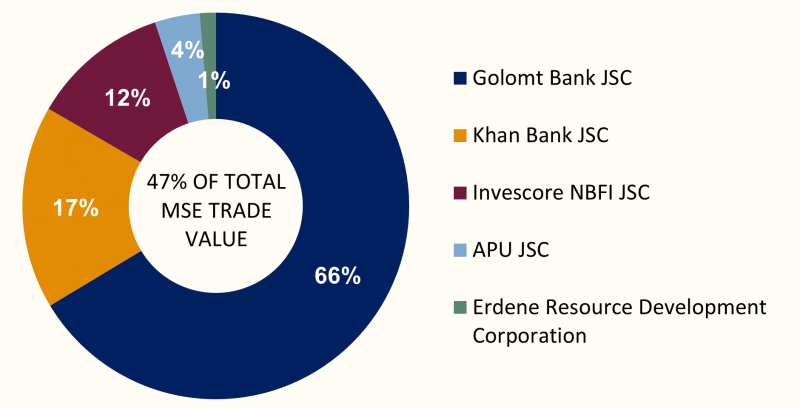
Over the course of the week, a total of 6.99 million securities with a combined value of MNT 15.07 billion were traded on the Mongolian Stock Exchange. In terms of trading value, the most actively traded companies were Golomt Bank JSC, Khan Bank JSC, Invescore NBFI JSC, APU JSC, and Erdene Resource Development Corporation. During the same period, three block trades were executed:
- Invescore NBFI JSC (INV) traded 80 thousand shares at MNT 9,870 per share, amounting to MNT 789.6 million in total turnover.
- Golomt Bank JSC (GLMT) saw 1.7 million shares traded at MNT 1,301 per share, generating approximately MNT 2.2 billion in trading value.
- Golomt Bank JSC (GLMT) traded 233 thousand shares traded at MNT 1,293 per share, generating approximately MNT 302 million in trading value.
Over the past week, Mongolian Stock Exchange indices exhibited relatively low volatility and stable trading dynamics. The TOP-20 Index declined by 0.37%, while the MSE A Index decreased by 0.15%. In contrast, the MSE B Index recorded a gain of 0.59%. The decline in the TOP-20 and MSE A indices suggests mild weakness in large-cap stocks that carry significant weight in overall market capitalization. Meanwhile, the increase in the MSE B Index indicates some positive movement within other segments of the market. Overall, the limited magnitude of index changes reflects the absence of sharp movements or heightened volatility, pointing to relatively stable market conditions during the week.
| INDEX | POINTS | WEEKLY CHANGE |
| TOP 20 Index | 51,811.74 | -0.37% |
| MSE A Index | 20,072.08 | -0.15% |
| MSE B Index | 14,596.75 | +0.59% |
⇒ THE MONGOLIAN TUGRIK CONTINUED TO DEPRECIATE AGAINST THE U.S. DOLLAR AND OTHER MAJOR CURRENCIES IN FEBRUARY
According to the National Statistics Office, the Mongolian tugrik continued to weaken against the U.S. dollar and other major currencies in February 2026. The monthly average exchange rate reached MNT 3,565.87 per USD, reflecting a depreciation of MNT 4.8 month-on-month and MNT 106.7 year-on-year.
The tugrik also weakened notably against the euro, with the exchange rate rising to MNT 4,221.12 per EUR, marking a depreciation of MNT 41.6 MoM and MNT 619.7 YoY, representing the largest movement among major currencies.
A similar trend was observed across other currencies. The tugrik depreciated to MNT 46.31 per RUB (+0.7 MoM, +8.7 YoY) and MNT 516.38 per CNY (+5.4 MoM, +41 YoY), indicating continued broad-based weakness.
Key indicators:
- USD/MNT: 3,565.87 (+4.8 MNT MoM, +106.7 MNT YoY)
- EUR/MNT: 4,221.12 (+41.6 MNT MoM, +619.7 MNT YoY)
- RUB/MNT: 46.31 (+0.7 MNT MoM, +8.7 MNT YoY)
- CNY/MNT: 516.38 (+5.4 MNT MoM, +41 MNT YoY)
The tugrik recorded broad-based depreciation against major currencies in February, indicating continued pressure in the FX market. While month-on-month movements remained relatively modest, year-on-year depreciation is more pronounced—particularly against the euro. This suggests short-term stability in exchange rate movements, alongside a continued weakening trend over the medium term.
⇒ PRIMARY MARKET ISSUANCE OF “MUNICIPAL BOND” SUCCESSFULLY COMPLETED WITH 100% SUBSCRIPTION
Pursuant to Resolution No. 25/145 dated December 26, 2025 of the Ulaanbaatar City Council and Resolution No. 49 dated February 11, 2026 of the Government of Mongolia, a total of 200,000 units of “Municipal Bond” with a face value of MNT 1 million, tenor of 3 years, and annual coupon of 14% were offered to the public. The primary market issuance, aiming to raise MNT 200 billion, was successfully completed with full subscription.
Proceeds raised from the bond issuance will be allocated to the initial phase of the Thermal Power Plant No. 5 (TPP-5) project, aimed at expanding Ulaanbaatar’s energy supply capacity. The first unit of the project is scheduled for commissioning in Q1 2028, with subsequent units expected to be completed within the same year, contributing to improved electricity and heating supply in the northwestern region of the city.
MICC SC LLC acted as the underwriter for the transaction, structuring and executing the public offering and successfully managing the primary market issuance. This transaction demonstrates the viability of utilizing domestic capital markets as a financing channel for large-scale infrastructure projects.
On a weekly basis, global equity market performance diverged across regions. U.S. markets declined, European markets recorded steady gains, while Asian markets showed mixed performance. This divergence indicates that markets are not moving in a synchronized direction, but rather reflect region-specific dynamics driven by local conditions, market structures, and investor positioning.
U.S. STOCK MARKET
- S&P 500: -3.13%
- Dow Jones: -1.39%
- Nasdaq: -4.76%
U.S. equity markets traded under pressure throughout the week, with major indices recording notable declines. The S&P 500 fell -3.13%, while the Nasdaq dropped -4.76%, reflecting heightened volatility in growth and technology stocks. The Dow Jones declined -1.39%, indicating broader market weakness, although relatively defensive sectors provided some degree of stability. Overall, the week was characterized by a risk-off sentiment among investors, with short-term uncertainty remaining a dominant factor.
EUROPEAN STOCK MARKET
- FTSE 100: +0.74%
- STOXX Europe 600: +1.15%
- DAX 40 (Герман): +1.61%
- CAC 40 (Франц): +2.12%
European equity markets recorded steady gains, with major regional indices delivering broadly positive performance. The CAC 40 rose +2.12% and the DAX 40 increased +1.61%, indicating sustained buying activity in key markets. Meanwhile, the STOXX Europe 600 gained +1.15% and the FTSE 100 advanced +0.74%, reflecting support across a broad range of sectors.
ASIAN STOCK MARKET
- Nikkei 225: +1.72%
- KOSPI: -2.53%
- CSI 300: +0.08%
- SSEC : +0.22%
Asian equity markets showed mixed performance. Japan’s Nikkei 225 rose +1.72%, indicating relatively positive momentum within the region, while China’s CSI 300 (+0.08%) and SSEC (+0.22%) posted modest gains, reflecting broadly stable market conditions with limited movement. In contrast, South Korea’s KOSPI declined -2.53%, highlighting divergent performance across regional markets.
⇒ GEOPOLITICAL UNCERTAINTY CONTINUES TO WEIGH ON MARKETS, WHILE FUTURES EDGE HIGHER
U.S. equity futures opened slightly higher on Friday, with Dow Jones futures up +0.16%, while S&P 500 and Nasdaq 100 futures each gained around +0.2%. The modest rebound reflects short-term recovery amid ongoing geopolitical uncertainty.
The movement followed an announcement by U.S. President Donald Trump to delay potential strikes on Iran’s energy infrastructure until April 6. While negotiations are reportedly ongoing, uncertainty remains elevated as Iran has not clearly signaled willingness to engage in formal talks, leaving market risks largely unresolved.
Key indicators:
- Dow futures: +0.16%
- S&P 500 futures: +0.2%
- Nasdaq 100 futures: +0.2%
- S&P 500: -1.74% (previous session)
- Nasdaq: -2.38%
- Dow Jones: -1.01%
- AAII bearish sentiment: 49.8%
Asian markets showed mixed performance, reflecting the lack of clear directional momentum. Investor sentiment remains cautious, with bearish expectations among individual investors at 49.8%, above historical averages. While the uptick in futures suggests short-term stabilization, underlying market direction remains uncertain. Geopolitical risks—particularly developments in the Middle East—and oil price volatility continue to be key drivers for global equity markets.
⇒ JAPAN’S INFLATION EASES, SHIFT IN MONETARY POLICY OUTLOOK EXPECTED
Japan’s inflation rate declined to 1.3% in February 2026, down 0.2 percentage points month-on-month, marking the lowest level since March 2022. This places inflation below the Bank of Japan’s 2% target, indicating easing price pressures. The slowdown was driven primarily by moderating food price increases and weaker-than-expected economic growth in the previous quarter. Soft household consumption has also contributed to reduced underlying inflationary pressures.
Core inflation fell to 1.6%, down 0.4 percentage points MoM, while the more stable “core-core” measure remained around 2.5%, suggesting that underlying domestic price pressures have not fully dissipated.
External risks, however, remain. Geopolitical tensions in the Middle East and ongoing supply uncertainties continue to support higher global oil prices, posing upside risks to inflation—particularly for import-dependent economies such as Japan.
The decline in headline inflation below the target reduces near-term pressure on the Bank of Japan to tighten monetary policy. However, with core inflation still near the 2% level and external risks elevated, any policy adjustments are likely to be gradual and data-dependent.
⇒ CHINA’S INDUSTRIAL PROFITS SURGE 15.2%, SIGNALING ACCELERATING RECOVERY
China’s industrial profits increased by 15.2% year-on-year in the first two months of 2026, according to data from the National Bureau of Statistics. This marks a sharp acceleration from the 5.3% growth recorded in December 2025, indicating a strengthening recovery in the industrial sector.
The improvement was driven primarily by increased industrial activity and rising product prices. The high-tech manufacturing sector led profit growth, with earnings rising 58.7% YoY, supported by strong performance in industries such as unmanned aerial vehicles and semiconductors.
Upstream sectors also delivered robust gains, with profits in non-ferrous metals rising 148.2% and the chemical industry posting growth of 35.9%.
Despite the strong headline figures, the recovery remains uneven across sectors. Domestic demand continues to show weakness, and structural issues such as industrial overcapacity persist. Authorities also highlighted rising geopolitical tensions as a potential downside risk to growth.
On the energy front, disruptions to global oil supply stemming from developments in the Middle East continue to affect global markets. However, the impact on China is expected to be relatively contained, supported by domestic reserves, alternative energy sources, and continued crude oil imports from Iran.
Key indicators:
- Industrial profits: +15.2% YoY (Jan–Feb)
- Previous reading (Dec): +5.3% YoY
- High-tech manufacturing: +58.7%
- Non-ferrous metals: +148.2%
- Chemicals: +35.9%
The sharp increase in industrial profits points to improved near-term industrial momentum. However, weak domestic demand and uneven sectoral recovery raise questions about the sustainability of growth. Geopolitical risks and commodity price volatility remain key factors shaping the outlook.